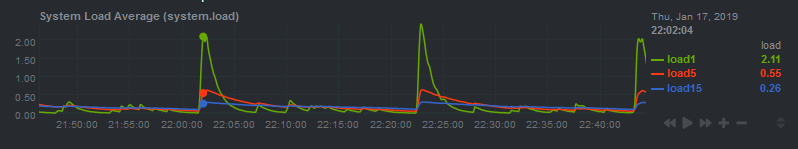
So I recently encountering a strange issue on two of my servers. I noticed that the load average was increasing approximately every 20 minutes:
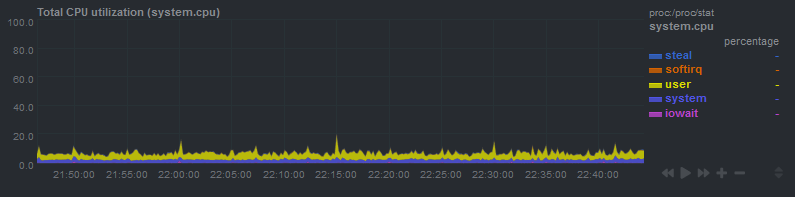
I suspected a cronjob, but I don't have any cronjobs that run every 20 mins. Also, CPU usage doesn't actually increase during that period:
I did some digging and it took a long time to work out what was happening.
So What Is Load Average Anyway?
"Load average" is a term used to describe a measure of how "busy" a system is. Unix-like systems (including Linux) show a load average as three numbers, representing the system load over the previous one minute, five minutes, and fifteen minutes. These numbers represent the number of processes that are using the CPU right now, waiting to use the CPU, or waiting for disk I/O. The Wikipedia article has more details.
Linux updates the load average every 5 seconds. In fact, it actually updates every 5 seconds plus one "tick". The reason for this is to avoid coinciding with other five-second timers:
It turns out that there are a few other five-second timers in the kernel, and if the timers get in sync, the load-average can get artificially inflated by events that just happen to coincide. So just offset the load average calculation it by a timer tick.
From the Linux kernel code:
#define LOAD_FREQ (5*HZ+1) /* 5 sec intervals */
* The global load average is an exponentially decaying average of nr_running +
 * nr_uninterruptible.
 *
 * Once every LOAD_FREQ:
 *
 *   nr_active = 0;
 *   for_each_possible_cpu(cpu)
 *	nr_active += cpu_of(cpu)->nr_running + cpu_of(cpu)->nr_uninterruptible;
 *
 *   avenrun[n] = avenrun[0] * exp_n + nr_active * (1 - exp_n)
HZ is the kernel timer frequency, which is defined when compiling the kernel. On my system, it's 250:
% grep "CONFIG_HZ=" /boot/config-$(uname -r)
CONFIG_HZ=250
This means that every 5.004 seconds (5 + 1/250), Linux calculates the load average. It checks how many processes are actively running plus how many processes are in uninterruptable wait (eg. waiting for disk IO) states, and uses that to compute the load average, smoothing it exponentially over time.
Say you have a process that starts a bunch of subprocesses every second. For example, Netdata collecting data from some apps. Normally, the process will be very fast and won't overlap with the load average check, so everything is fine. However, every 1251 seconds (5.004 * 250), the load average update interval will be an exact multiple of one second (that is, 1251 is the least common multiple of 5.004 and 1). 1251 seconds is 20.85 minutes, which is exactly the interval I was seeing the load average increase. My educated guess here is that every 20.85 minutes, Linux is checking the load average at the exact time that several processes are being started and are in the queue to run.
I confirmed this by disabling netdata and manually watching the load average:
while true; do uptime; sleep 5; done
After 1.5 hours, I did not see any similar spikes. The spikes only occur when Netdata is running.
It turns out other people have hit similar issues in the past, albeit with different intervals. The following posts were extremely helpful:
- Investigation of regular high load on unused machines every 7 hours
- Understanding why the Linux loadavg rises every 7 hours
- Telegraf - high load average every 1h 45m
- Linux commit that changed load average calculation to be every 5 seconds + 1 tick, instead of exactly every 5 seconds
In the end, I'm not sure if I'd call this a bug, but perhaps netdata could implement some jitter so that it doesn't perform checks every one second exactly. I posted a GitHub issue so their developers can take a look.